Fxdayprofit
  • Home
  • PRIVACY POLICY
  • DISCLAIMER
  • Forex Regulators
  • Home
  • Forex Account managed
  • Forex Downloads
    • Expert Adviser
    • Indicators
  • Learn Forex Tradingy
  • Trading Tips
  • About Us
  • Contact Us

Monday 10th December: Weekly technical outlook and review.

EUR/USD:
Weekly Gain/Loss: +0.38%
Weekly Close: 1.1393
Weekly perspective:
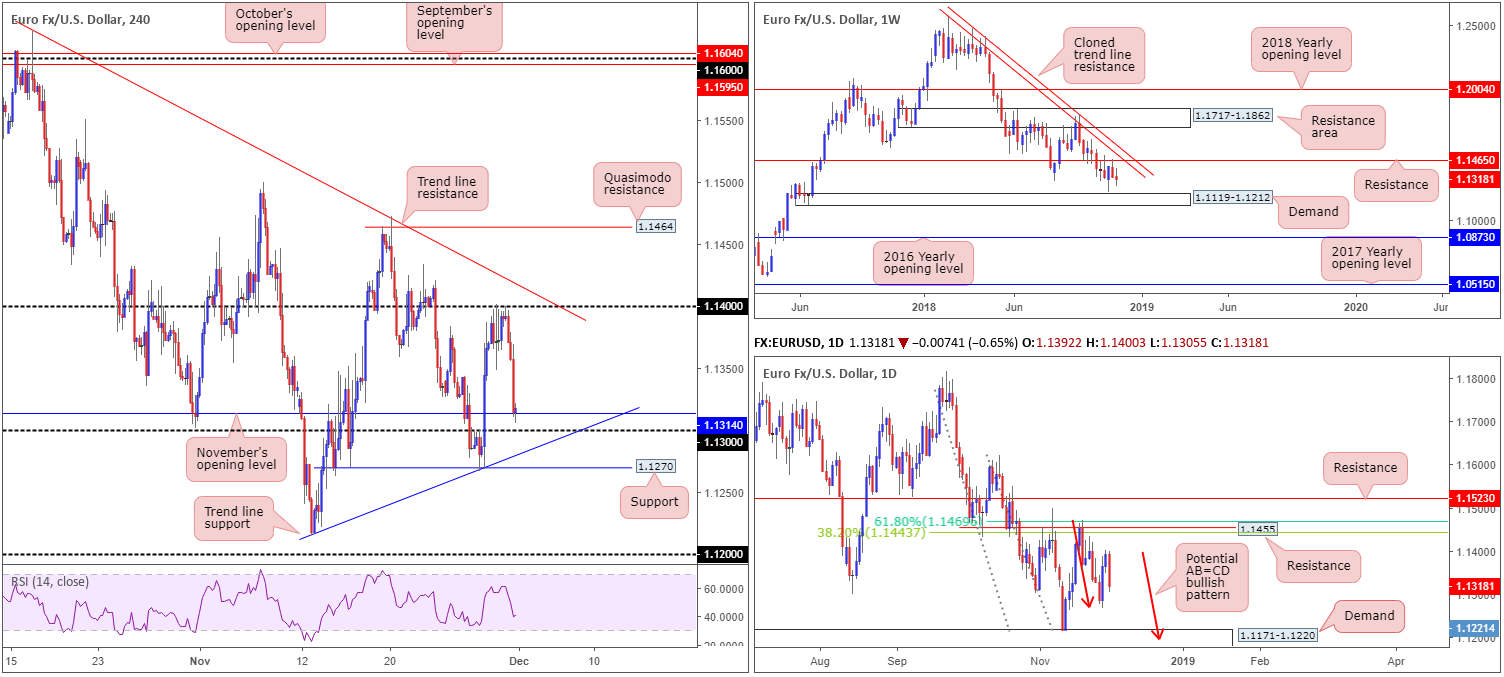
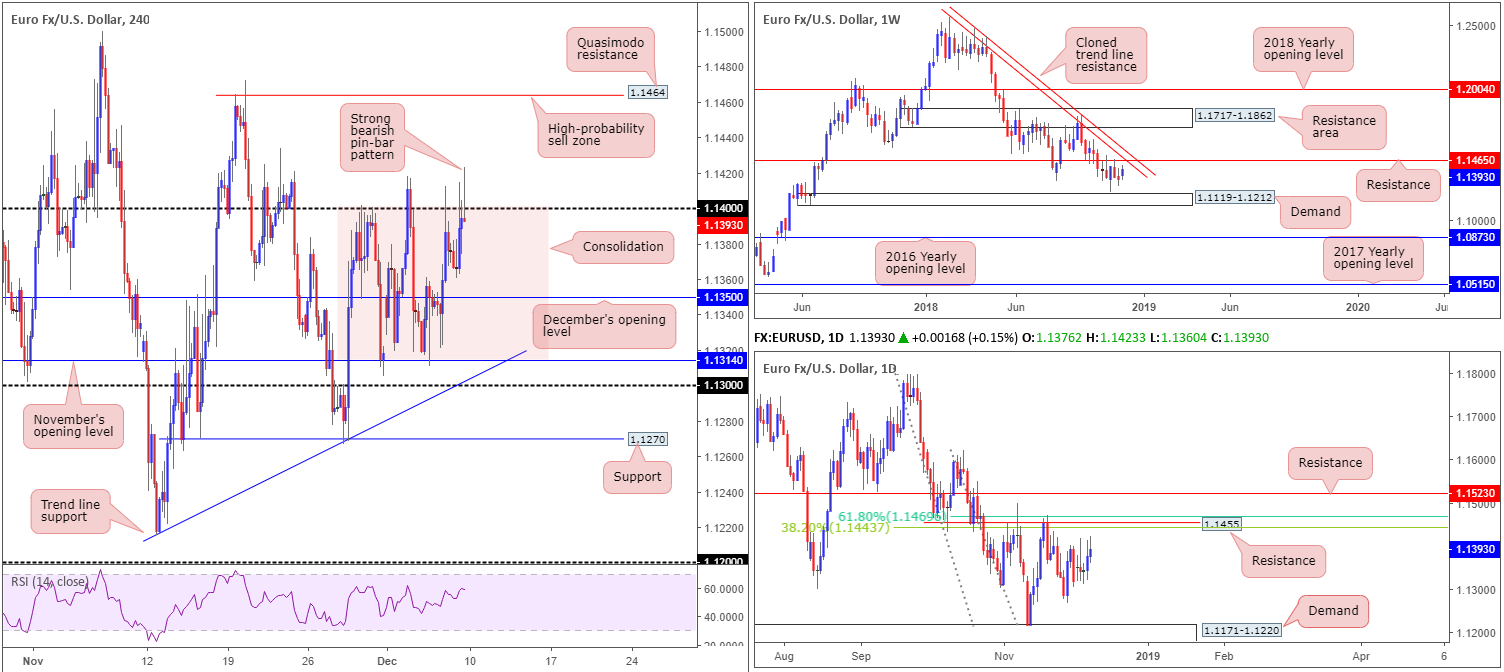
The single currency staged a reasonably decisive recovery over the course of last week, breaking a two-week bearish phase. Further buying, however, may be challenging. Less than 100 pips overhead resistance is seen priced in at 1.1465, which, as you can probably see, brings with it a nearby cloned trend line resistance (extended from the high 1.2413).
Daily perspective:
A closer reading on the daily timeframe adds a proven base of resistance circulating around the 1.1455 region. What’s appealing here, other than the fact the level capped upside three times in November and is closely linked to the weekly resistance mentioned above at 1.1465, is the merging Fibonacci resistances: a 61.8% and a 38.2% at 1.1469 and 1.1443, respectively.
H4 perspective:
Friday’s session witnessed the euro advance against its US counterpart, following substandard US employment data. US non-farm payrolls added 155k to the economy in November, falling sharply from the 250k (revised to 237k) addition seen in October and posting significantly below the 198k consensus. The US unemployment rate held steady at 3.7% and wages rose at a monthly pace of 0.2% in November, though came in below the 0.3% anticipated by the market.
Try as it might, though, the H4 candles failed to muster enough oomph to breach its 1.14 handle, and concluded the day/week forming a strong bearish pin-bar formation. Since November 29, the unit has been carving out a consolidation between November’s opening level at 1.1314 and 1.14. Note in between this range we also have December’s opening level coming in at 1.1350.
Areas outside of the current consolidation fall in at a Quasimodo resistance drawn from 1.1464 and the round number 1.13.
Areas of consideration:
Having seen both weekly and daily action poised to challenge their respective resistances (1.1465/1.1455), the research team notes to keep an eye out for a possible break above 1.14. A H4 close above this number followed up with a successful retest (stop-loss orders can be sited under the rejecting candle’s tail) would likely be enough evidence to justify an intraday long, targeting daily resistance seen at 1.1455.
If our analysis proves to be accurate and price action explores higher ground above 1.14, a high-probability shorting opportunity also exists around the H4 Quasimodo resistance mentioned above at 1.1464. This is due to where it is positioned on the higher timeframes. Traders either have the choice of waiting for additional candlestick confirmation to form and entering based on the selected structure, or simply entering at 1.1464 and positioning stop-loss orders above the apex of the H4 Quasimodo (1.1472). Without seeing the approach, 1.14 appears to be a logical starting point in terms of take-profit targets.
Today’s data points: Limited.
GBP/USD:
Weekly Gain/Loss: -0.28%
Weekly Close: 1.2729
Weekly perspective:
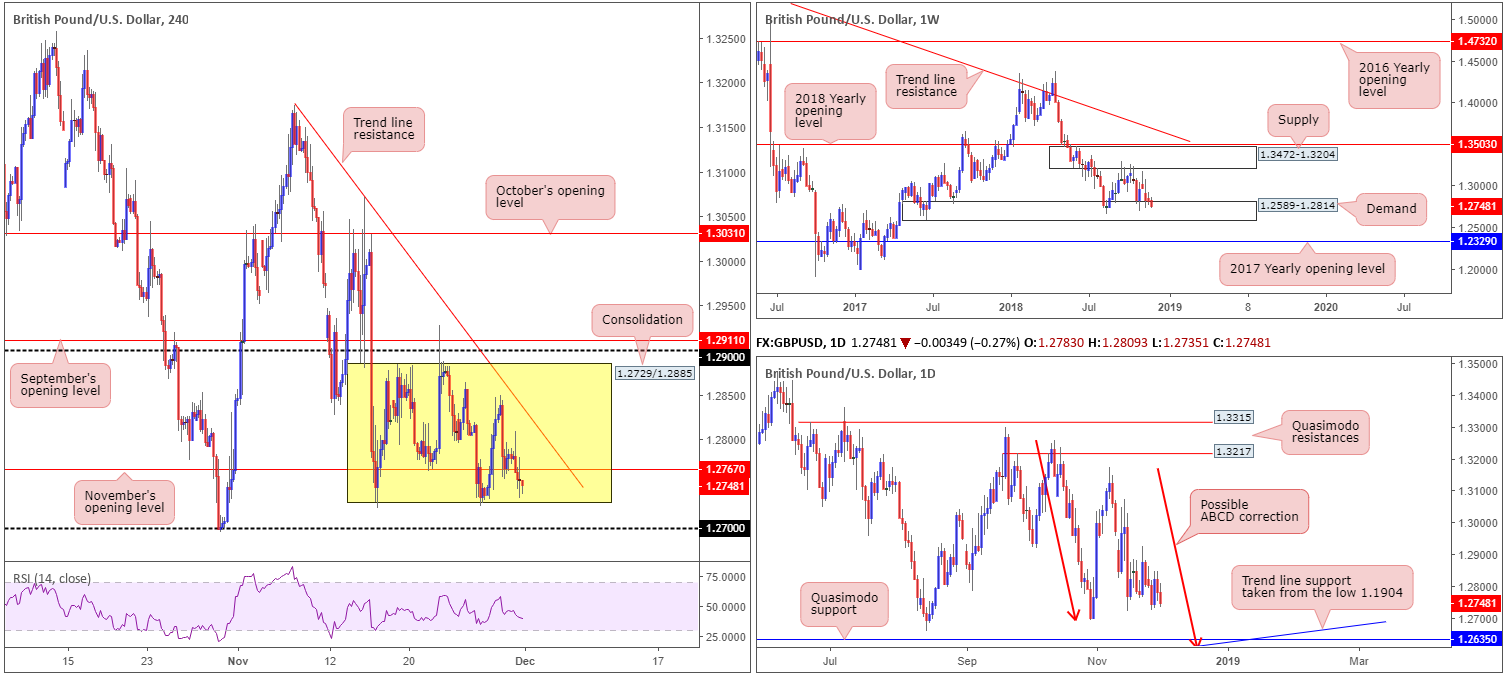
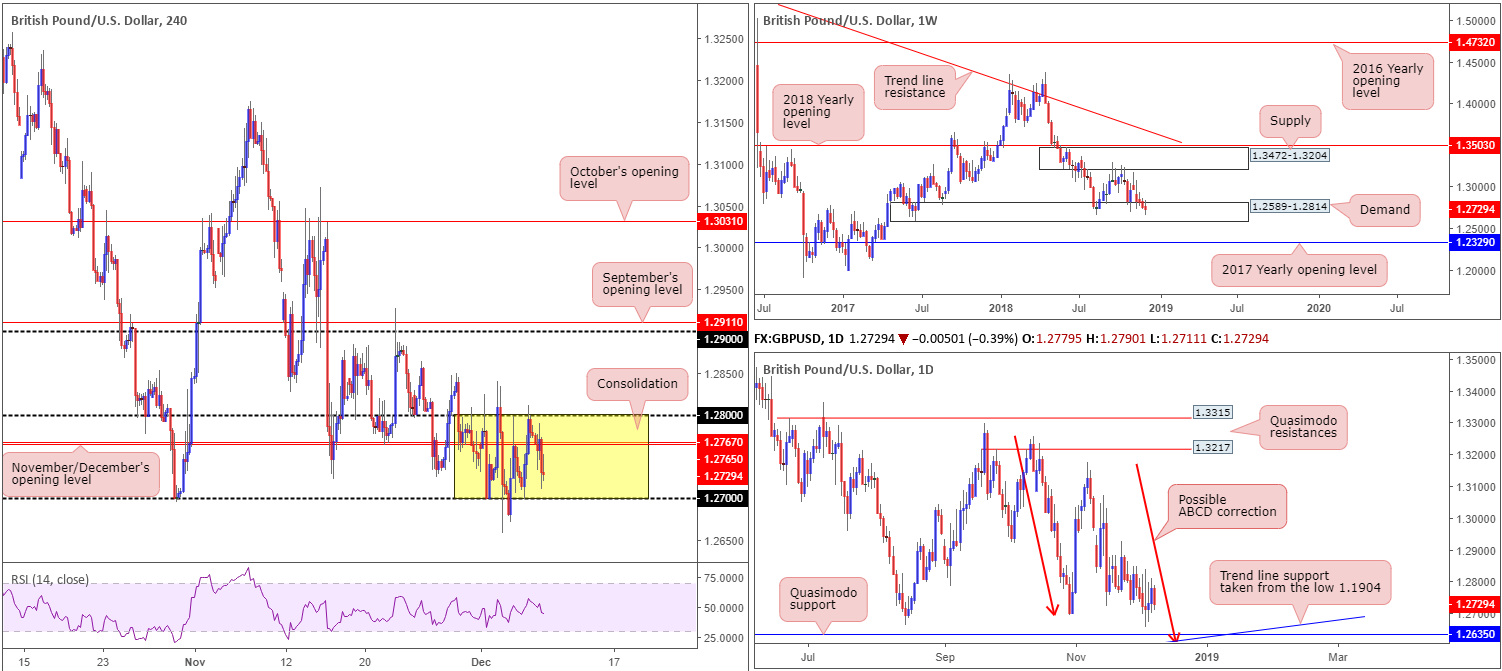
For the last five weeks sterling has registered losses, with four of those weeks involving a demand area at 1.2589-1.2814. As you can see, since striking the zone, price action has failed to produce anything meaningful to the upside, consequently reflecting a bleak tone at the moment. Traders, therefore, may want to pencil in the 2017 yearly opening level at 1.2329 in the event we push for lower ground.
Daily perspective:
In conjunction with weekly movement, daily flow suggests the pair might want to explore lower levels within the walls of the said weekly demand area. The Quasimodo support seen at 1.2635 remains an appealing barrier. Aside from 1.2635 fusing with trend line support (taken from the low 1.1904), the approach, should we trade lower, will form by way of an ABCD bullish pattern (red arrows) terminating just south at 1.2614.
H4 perspective:
Friday witnessed the GBP/USD exchange rate spike to highs of 1.2790, following a largely disappointing US jobs report. Despite some day-to-day volatility the British pound has remained consolidating in an increasingly restrictive range between 1.28 and 1.27 since the beginning of last week. It may also be worth noting that within the current consolidation November/December’s opening levels at 1.2767 and 1.2765 are visible.
A breakout above the aforesaid range could lead to price action swiftly exploring ground as far north as 1.29. This is due to the lack of active supply between 1.28/1.29. Beneath 1.27, on the other hand, traders likely have their crosshairs fixed on the daily Quasimodo support highlighted above at 1.2635.
Areas of consideration:
A H4 close above 1.28 – coupled with a retest as support in the shape of a bullish candlestick formation (entry/stop parameters can be defined according to this pattern) – is likely enough evidence to condone a long towards 1.29.
A H4 close under 1.27 that’s also accompanied by a retest by way of a bearish candlestick structure is likely enough to sell, targeting the daily Quasimodo support mentioned above at 1.2635.
Longer term, nonetheless, focus remains drawn towards the daily Quasimodo support at 1.2635 for potential longs. The fact this level is positioned within the current weekly demand, and fuses with a daily ABCD correction point as well as a trend line support, marks a reasonably strong buy zone for future use.
Today’s data points: MPC Member Cunliffe Speaks; UK GDP m/m; UK Manufacturing Production m/m.
AUD/USD:
Weekly Gain/Loss: -2.43%
Weekly Close: 0.7198
Weekly perspective:
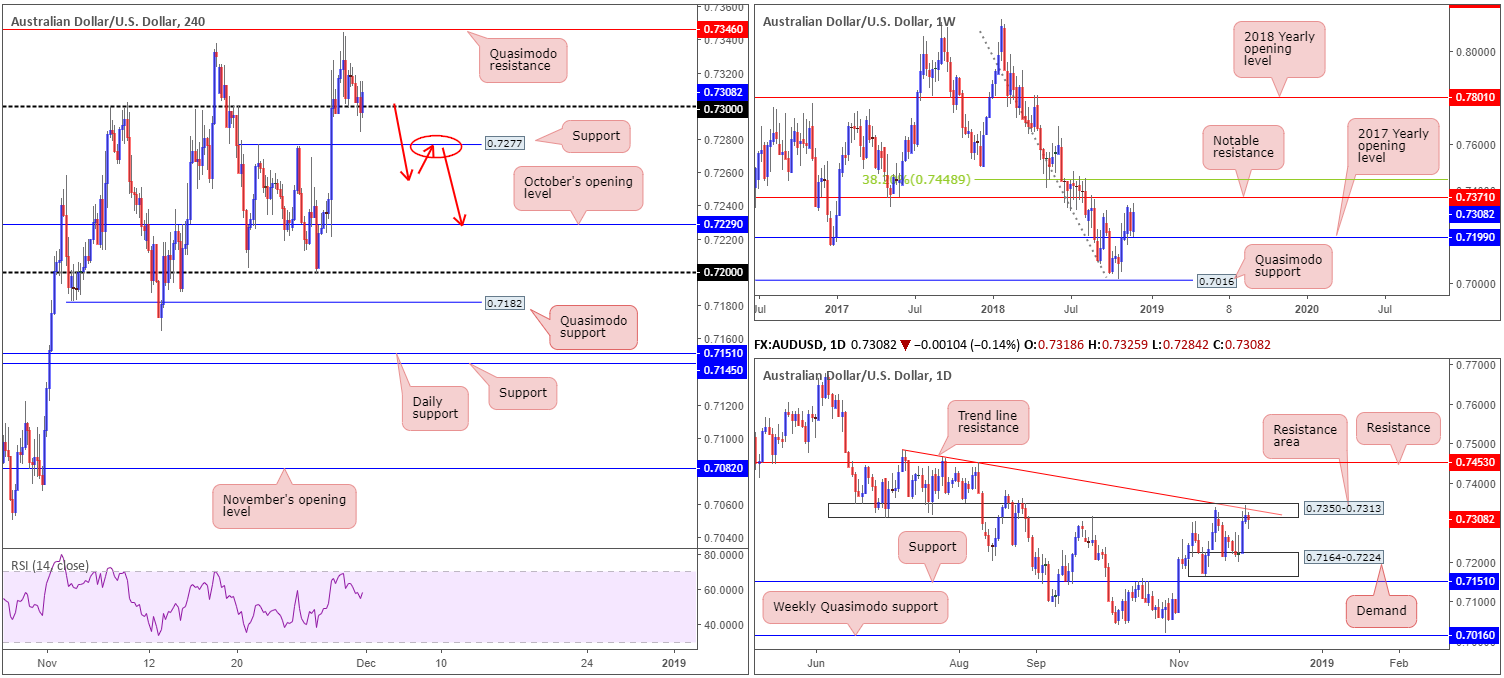
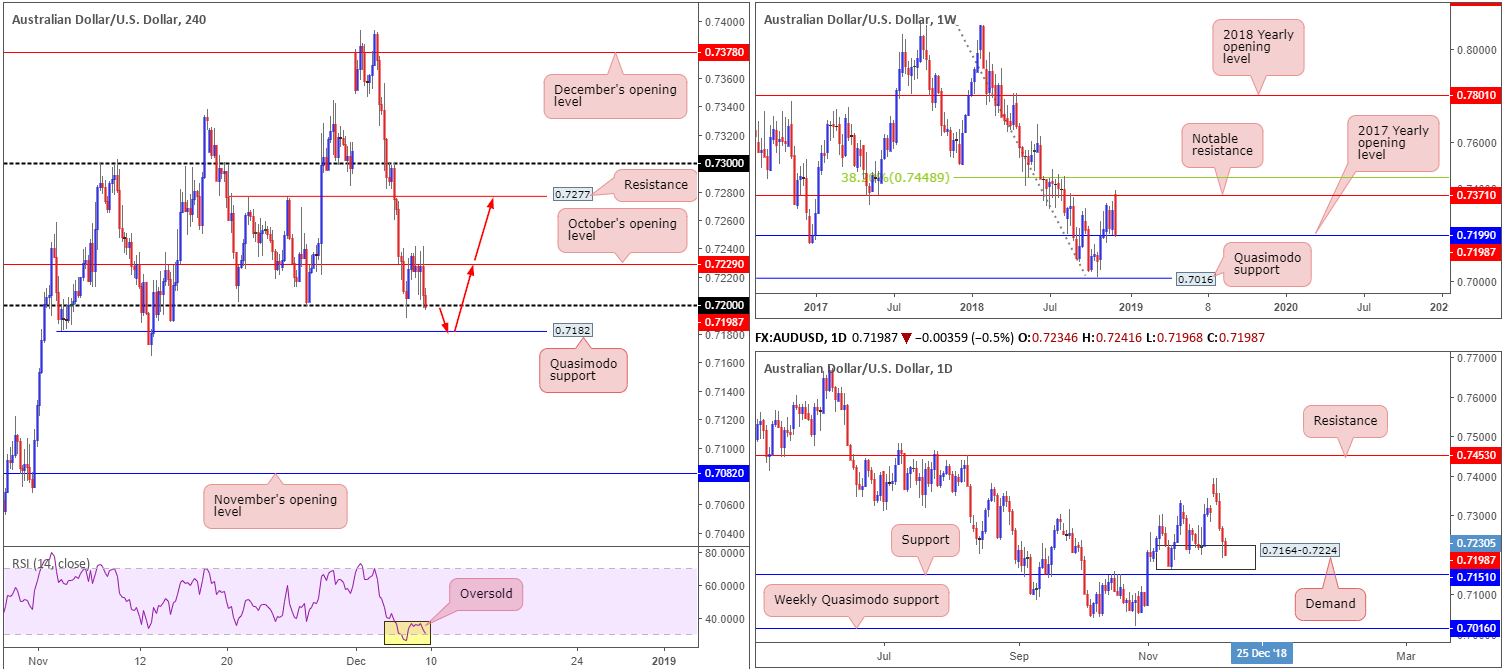
Despite a healthy start to the week following the G-20 meeting ending with a 90-day truce between the US and China, the AUD/USD failed to overthrow notable resistance priced in at 0.7371 and spent the remainder of the week grinding south. Down almost 200 pips in the shape of a near-full-bodied bearish candle, the market concluded the session touching gloves with the 2017 yearly opening level at 0.7199.
Daily perspective:
Supporting the 2017 yearly opening level, daily structure offers a demand base at 0.7164-0.7224. Having seen this area hold price action higher once already in late November, however, traders might want to pencil in the possibility of this zone giving way to a fakeout towards nearby support coming in at 0.7151.
H4 perspective:
In spite of the H4 candles momentarily spiking to highs of 0.7240 on the back of a weaker-than-expected US employment report Friday, price failed to decisively overthrow October’s opening level at 0.7229. This eventually brought the market back to its 0.72 handle into the closing stages of the week. Hovering directly beneath 0.72 is a Quasimodo support coming in at 0.7182. This level remains fresh (has yet to be tested) and may be worthy of a bounce higher this week. Another point to bear in mind is the RSI indicator is currently displaying an oversold reading.
Areas of consideration:
With weekly action seen nursing recent losses around a notable support: the 2017 yearly opening level at 0.7199, along with daily price shaking hands with demand at 0.7164-0.7224 (albeit a potentially fragile zone), buyers may still have a hand in this fight.
Ultimately, though, we do believe a stop run beneath 0.72 will occur on the H4 to bring in buyers at the H4 Quasimodo support level mentioned above at 0.7182. A rebound from this level that prints a H4 close above 0.72 (stop-loss orders can be sited under the breakout candle’s tail) would be a good indication of buyer intent to at least October’s opening level at 0.7229. Beyond here, eyes are likely fixed on H4 resistance priced in at 0.7277, followed by the 0.73 handle.
Today’s data points: Limited.
USD/JPY:
Weekly Gain/Loss: -0.84%
Weekly Close: 112.68
Weekly perspective:
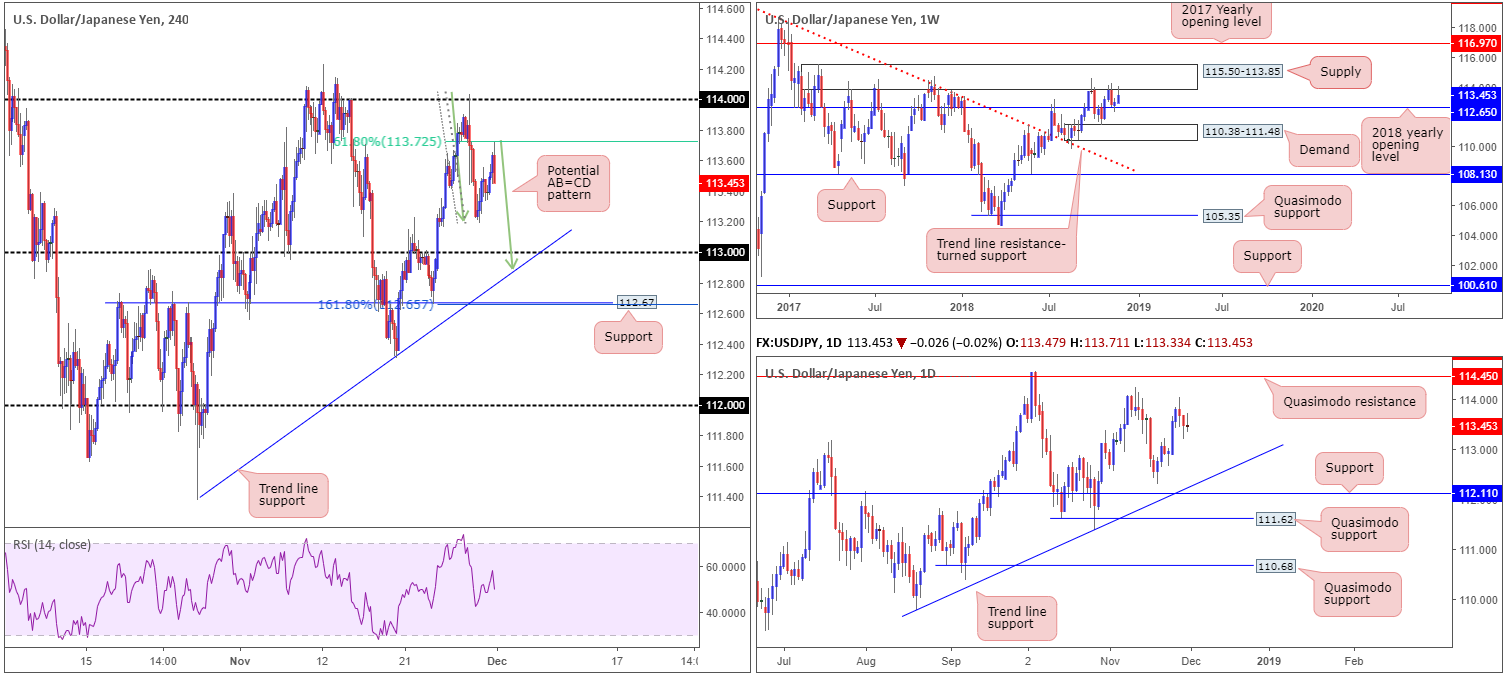
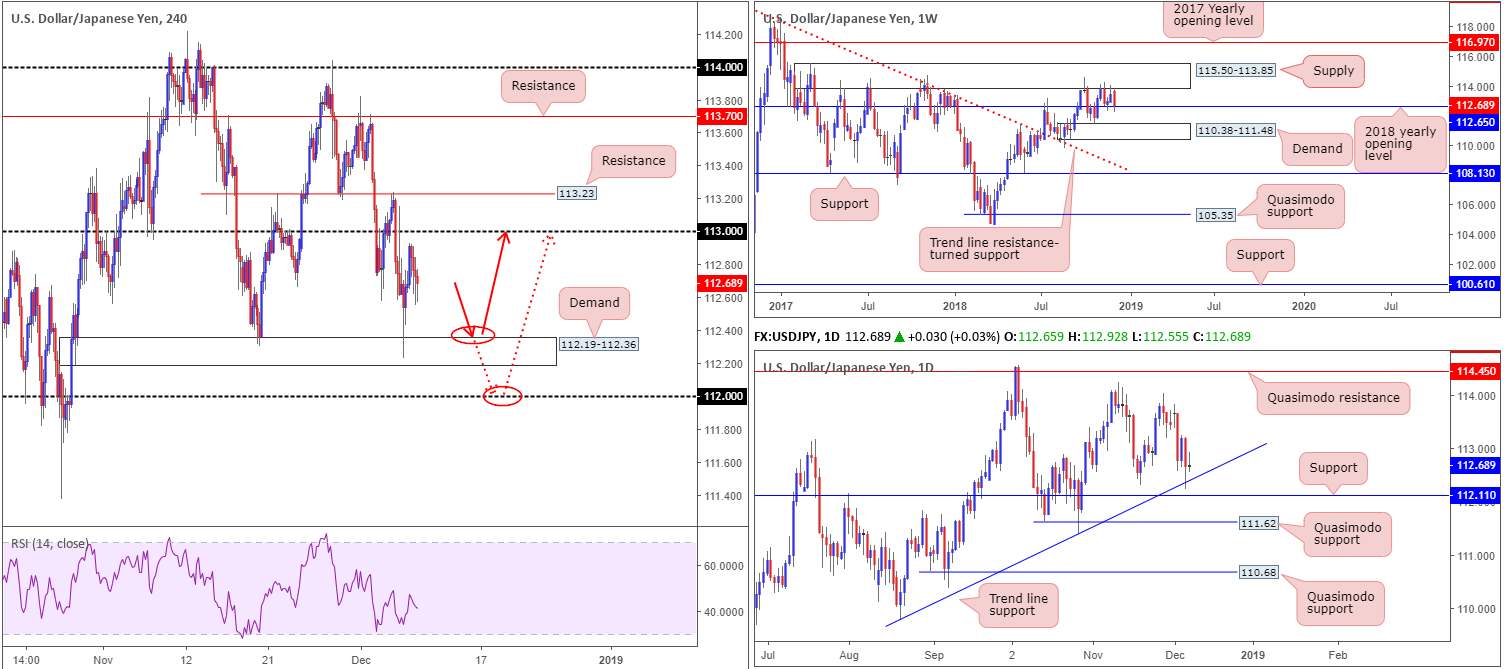
Since the beginning of November, the weekly candles have been capped between supply at 115.50-113.85 and the 2018 yearly opening level at 112.65. Beyond this level, demand coming in at 110.38-111.48 is on the radar, whereas a break above the current supply has the 2017 yearly opening level to target at 116.97.
In view of the market concluding trade a few pips above 112.65, a phase of buying may materialize this week.
Daily perspective:
In support of weekly price advancing higher, daily movement recently checked in with a trend line support (etched from the low 109.77). The question, nevertheless, is whether the ascending line will succumb to a fakeout play towards nearby support carved from 112.11, or continue advancing north from current price.
H4 perspective:
A quick recap of Friday’s movement on the H4 timeframe reveals the unit attempted to extend gains out of demand at 112.19-112.36, though failed to reach the 113 handle. Influenced by an overall disappointing US job’s report, the candles rotated from highs of 112.92 and concluded the day unchanged.
Areas of consideration:
Although the higher timeframes show scope for a push higher, defining an entry point on the H4 timeframe is proving troublesome at current price. With that being the case, the research team will only consider this a buyers’ market should the unit retest the H4 demand area mentioned above at 112.19-112.36, or whipsaw through this area and draw in buyers from 112 (red arrows). The latter will likely trip stop-loss orders beneath the said H4 demand and, therefore, provide liquidity for bigger money to get involved.
As it’s impossible to decipher which zone will react, if any, traders are urged to wait and see if additional bullish candlestick confirmation emerges before pulling the trigger (entry/stop parameters can be defined according to this pattern). In terms of take-profit targets, the 113 handle appears a logical starting base, shadowed by H4 resistance at 113.23.
Today’s data points: Limited.
USD/CAD:
Weekly Gain/Loss: +0.66%
Weekly Close: 1.3321
Weekly perspective:
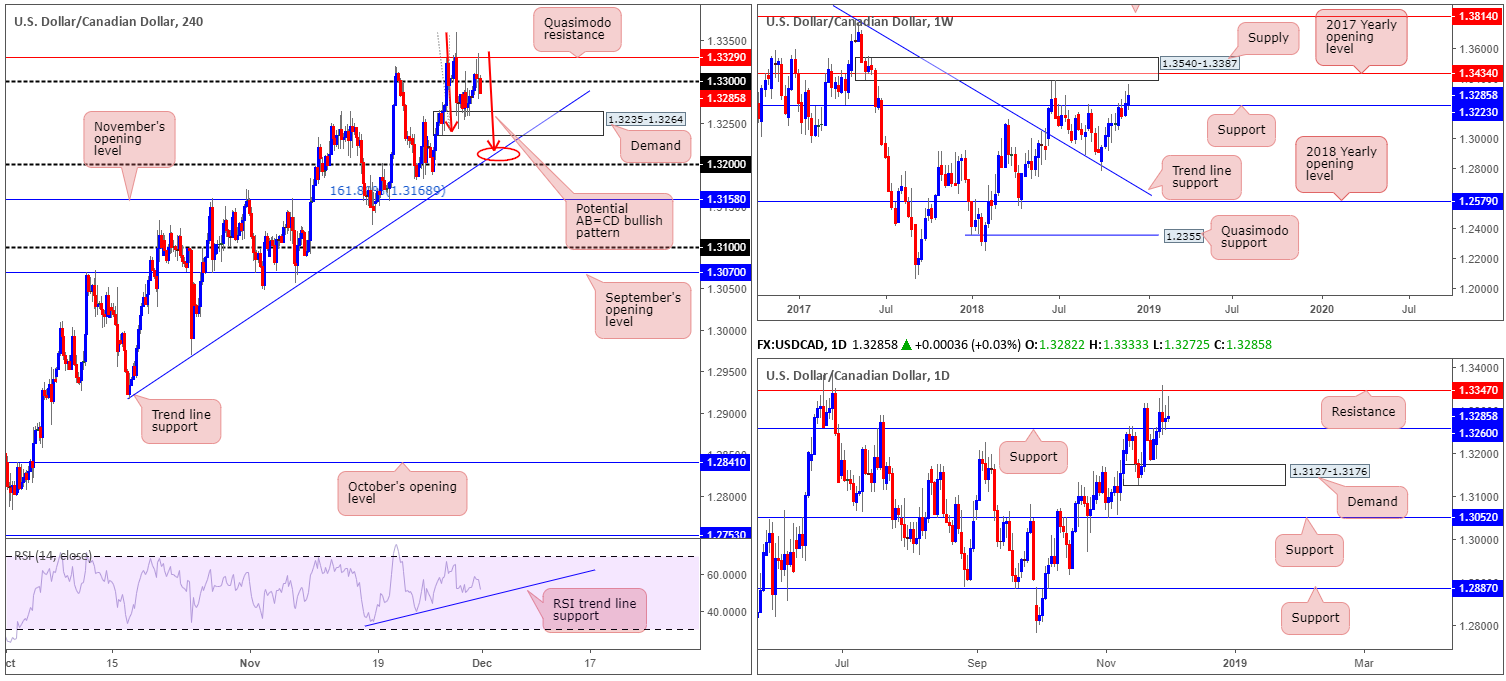
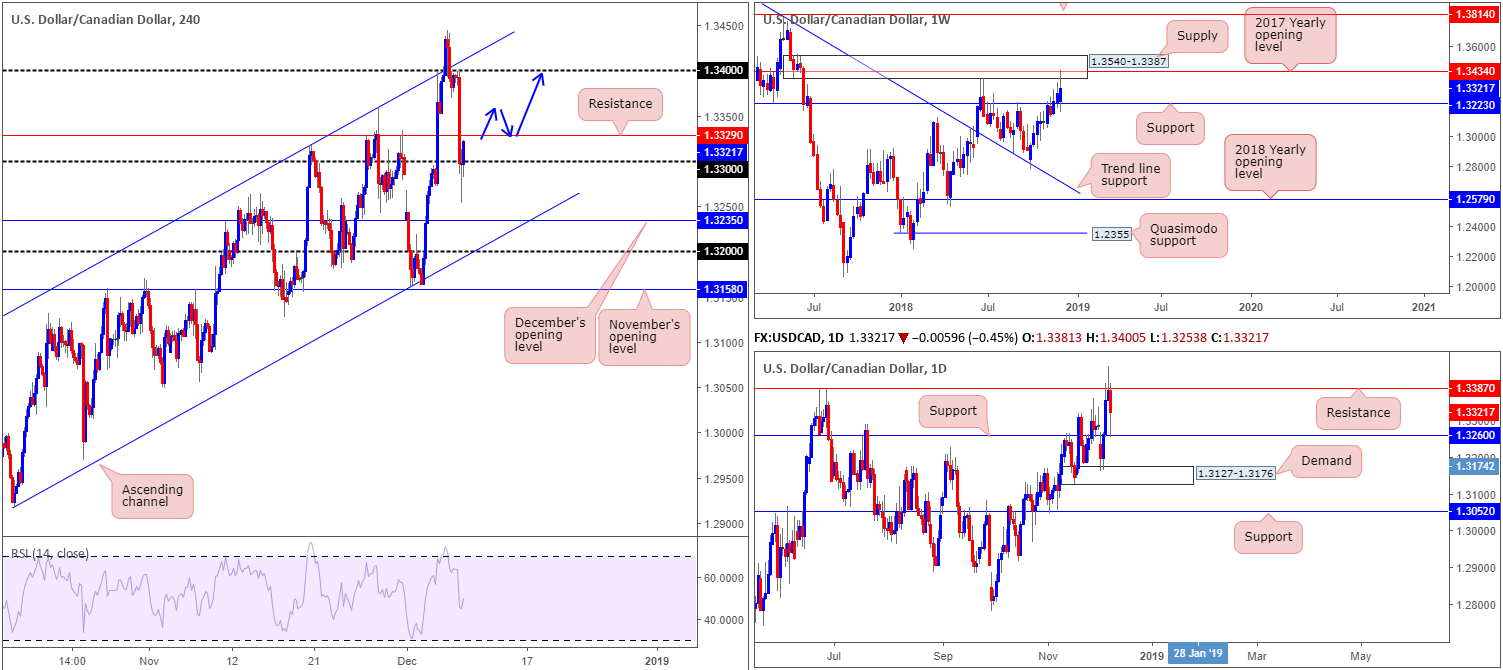
USD/CAD bulls remained on the offensive last week, increasing its value by an additional 80 pips. Support at 1.3223 remains in the fold and now, thanks to recent buying, so is a nearby supply at 1.3540-1.3387 (houses the 2017 yearly opening level within at 1.3434). Both the support and supply carry equal weight, according to our research team.
Daily perspective:
Similar to weekly structure, daily price is visibly capped between resistance coming in at 1.3387 (essentially represents the underside of weekly supply) and support drawn from 1.3260. A decisive push above the aforesaid resistance likely unlocks the door towards resistance priced in at 1.3533 (not seen on the screen), whereas a breach of the current support level has demand at 1.3127-1.3176 in sight.
H4 perspective:
Friday’s volatile moves between 1.3400-1.3255 were prompted by starkly contrasting Canadian vs. US jobs reports, at least in headline terms. The former added a stellar 94k+ to its tally vs. a mere 10.5k consensus, with the latter adding 155k jobs to the economy, significantly below the 198k consensus. Couple this with an upsurge in crude oil prices, Friday’s session ended in negative territory, despite reclaiming 1.33+ status into the close.
Areas of consideration:
Well done to any of our readers who managed to take advantage of Friday’s move lower, as a retest to the underside of 1.34 was a noted move to keep eyes on.
Going forward, we see this a difficult market to buy intraday until H4 resistance at 1.3329 is engulfed. A close above here likely clears the pathway north back up to around 1.34. In fact, a H4 close above 1.3329 that’s followed up with a retest as support (preferably in the shape of a bullish candlestick configuration as this helps define entry/stop levels) is of interest this week, knowing we also have room to stretch higher on the higher timeframes to at least 1.3387 after bouncing from daily support mentioned above at 1.3260.
Today’s data points: Gov. Council Member Lane Speaks.
USD/CHF:
Weekly Gain/Loss: -0.81%
Weekly Close: 0.9896
Weekly perspective:
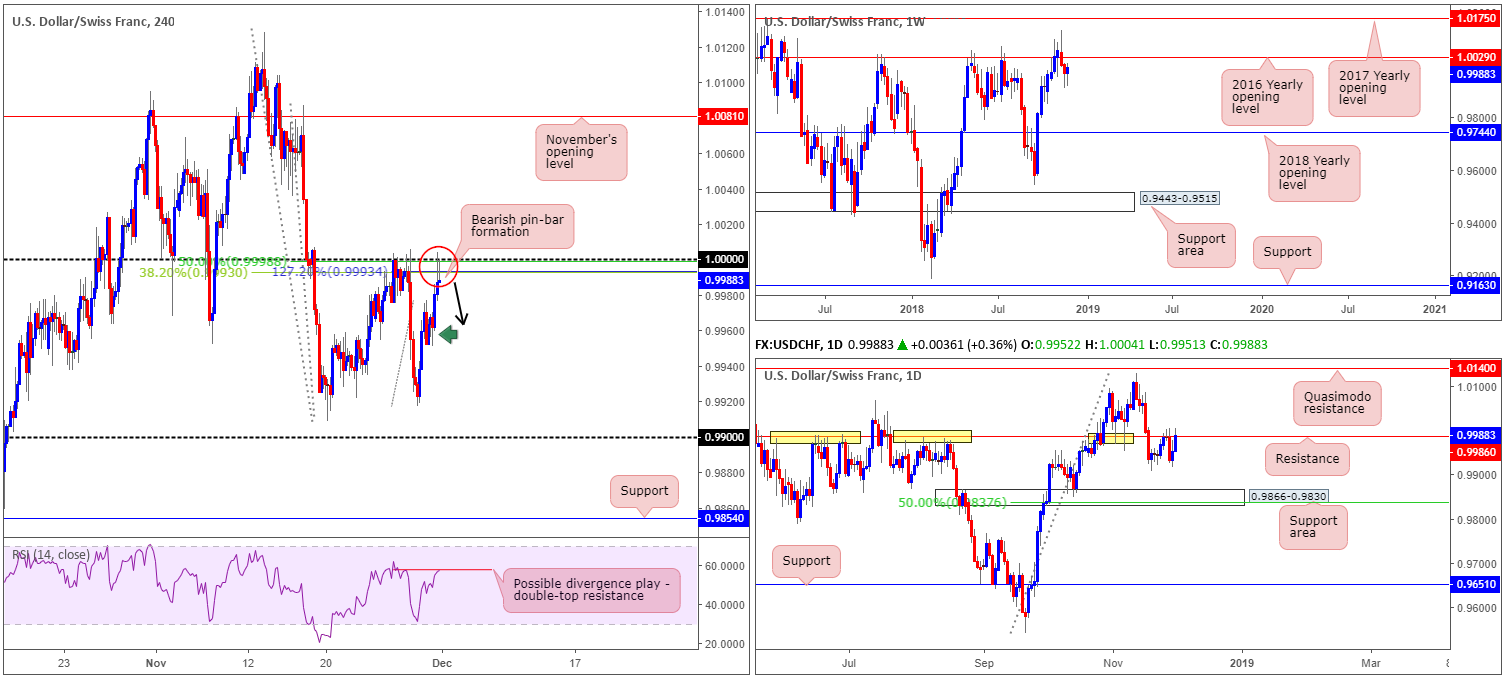
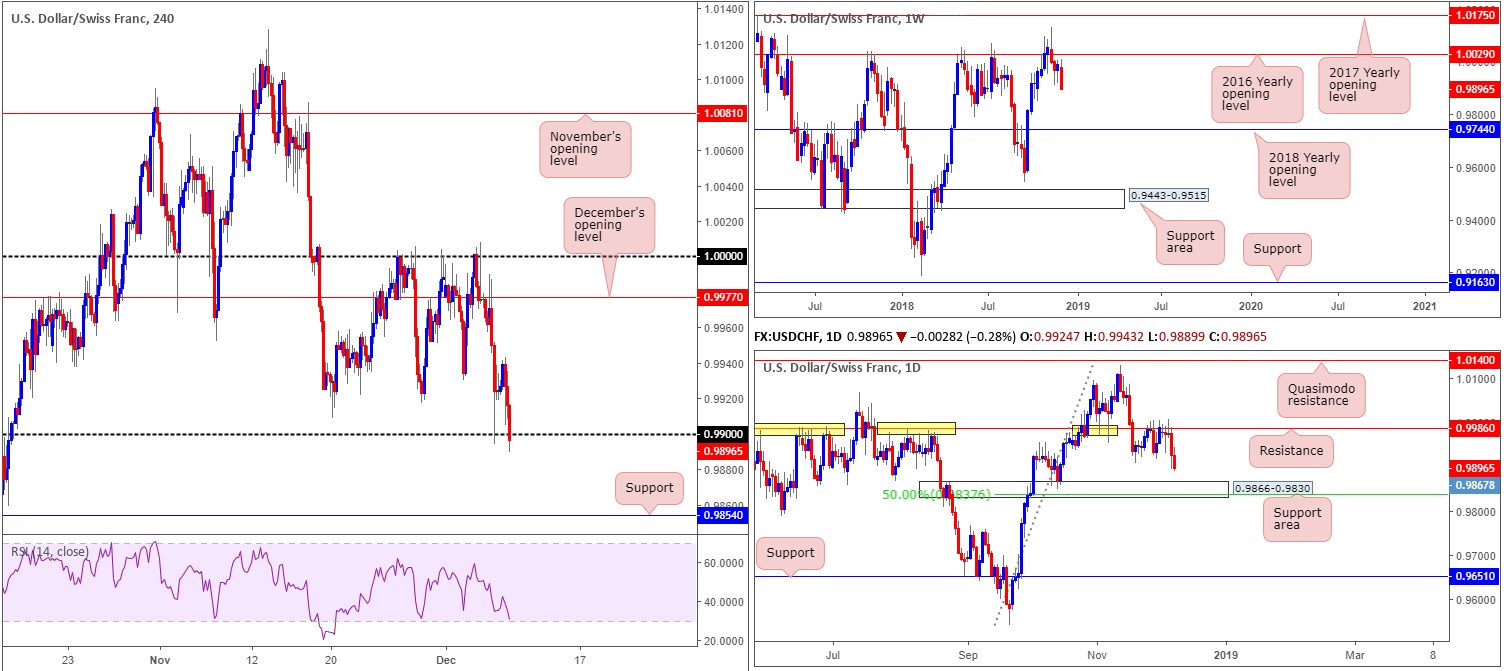
In form of a robust bearish engulfing candle printed just south of the 2016 yearly opening level at 1.0029, the USD/CHF market declined in excess of 80 pips last week. According to weekly structure, additional selling could materialize this week having seen the next support target not come into play until the 2018 yearly opening level at 0.9744.
Daily perspective:
The weekly timeframe’s bearish vibe is also echoed on the daily timeframe after meeting strong selling opposition off resistance at 0.9986. The level, as you can see (yellow), boasts incredibly strong historical significance. The only difference between the weekly/daily timeframes is daily movement shows its next downside target falls in relatively close by at 0.9866-0.9830 in the form of a support area.
H4 perspective:
Fuelled by a lower-than-expected US employment report Friday, the US dollar ceded ground to its Swiss counterpart. Despite a reasonably strong defensive posture Thursday off 0.99, recent selling tugged price action under the round number into the close.
Beneath 0.99, the research team has underlined support at 0.9854 as a potential downside target, though let’s keep in mind price action could find support ahead of this number at 0.9866: the top edge of the daily support area.
Areas of consideration:
With the higher timeframes signifying further selling, as well as a mild close printing under 0.99, further downside is likely in store. As long as H4 price remains defensive beneath 0.99 and preferably retests the underside of the number as resistance, this, according to the overall technical picture, is likely sufficient enough to justify a sell (stop-loss orders can be positioned above the rejecting candle’s wick), targeting the top edge of the daily support area mentioned above at 0.9866 as an initial take-profit zone.
Today’s data points: Limited.
Dow Jones Industrial Average:
Weekly Gain/Loss: -4.52%
Weekly Close: 24430
Weekly perspective:
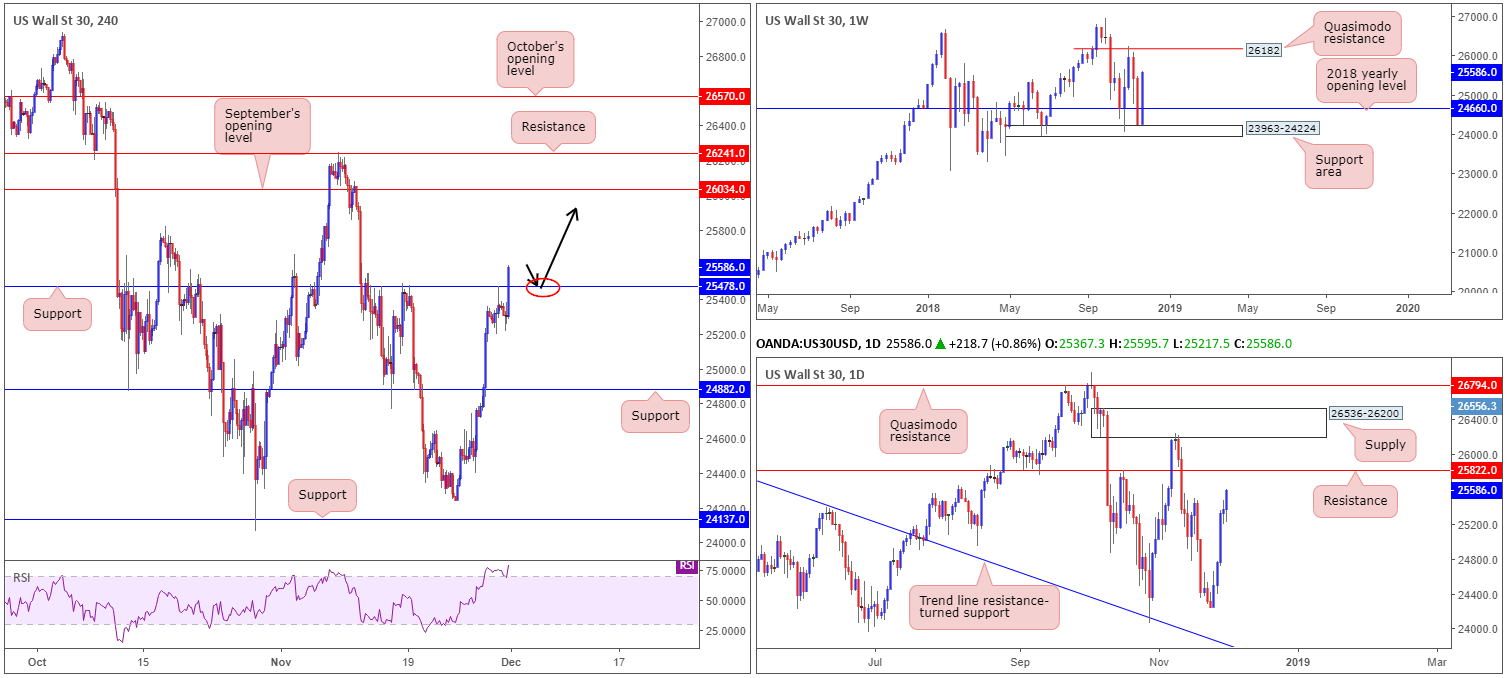
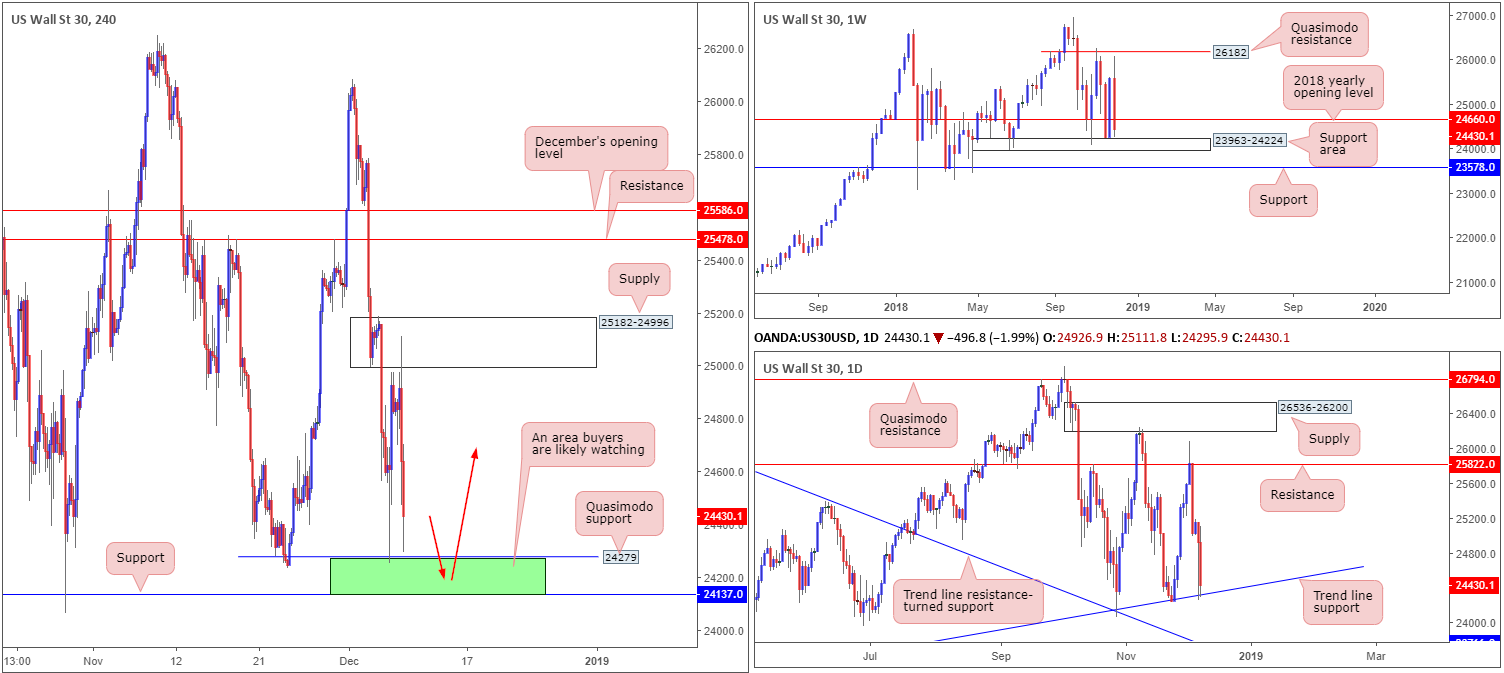
After coming within close proximity to a Quasimodo resistance at 26182 in recent sessions, the US equity index turned aggressively lower and reclaimed its 2018 yearly opening level at 24660 to the downside, erasing in excess of 1000 points. Despite this, the unit may find active buying reenter the market this week from a nearby support area coming in at 23963-24224. Failure to hold could lead to a move towards support at 23578.
Daily perspective:
Entering the later stages of last week witnessed price action retest trend line support (extended from the low 23055). On the condition this level fails to hold ground this week, Quasimodo support at 23766 (drawn from the month of April – not seen on the screen) and its converging trend line resistance-turned support (taken from the high 26670) are the next hurdles on the hit list.
H4 perspective:
A brief look at recent dealings on the H4 timeframe reveals the candles eventually drove to highs of 25111 following Friday’s dismal US employment numbers. Fading supply at 25182-24996 into early US hours, the index ended the day mildly paring losses just north of a Quasimodo support at 24279. Beyond here, there’s also a notable support level present nearby at 24137.
Areas of consideration:
In view of our technical reading, the higher-timeframe picture shows buying could enter the fold sometime this week, particularly off the weekly support area mentioned above at 23963-24224. With that being the case, traders are urged to keep a close eye on the green area shaded between the H4 Quasimodo support at 24279 and H4 support at 24137. Knowing this area houses the top edge of the said weekly support area and also has a close connection to the current daily trend line support, there are likely active buyers residing within this zone.
To help avoid being whipsawed out of a trade on a fakeout, the research team is advising to wait for additional candlestick confirmation before contemplating a long from 24137/24279. Not only will this show buyer intent, it’ll also provide entry/stop parameters. As for upside targets out of this zone, the underside of the 2018 yearly opening level on the weekly timeframe mentioned above at 24660 appears a logical starting point.
Today’s data points: Limited.
XAU/USD (Gold):
Weekly Gain/Loss: +2.14%
Weekly Close: 1248.1
Weekly perspective:
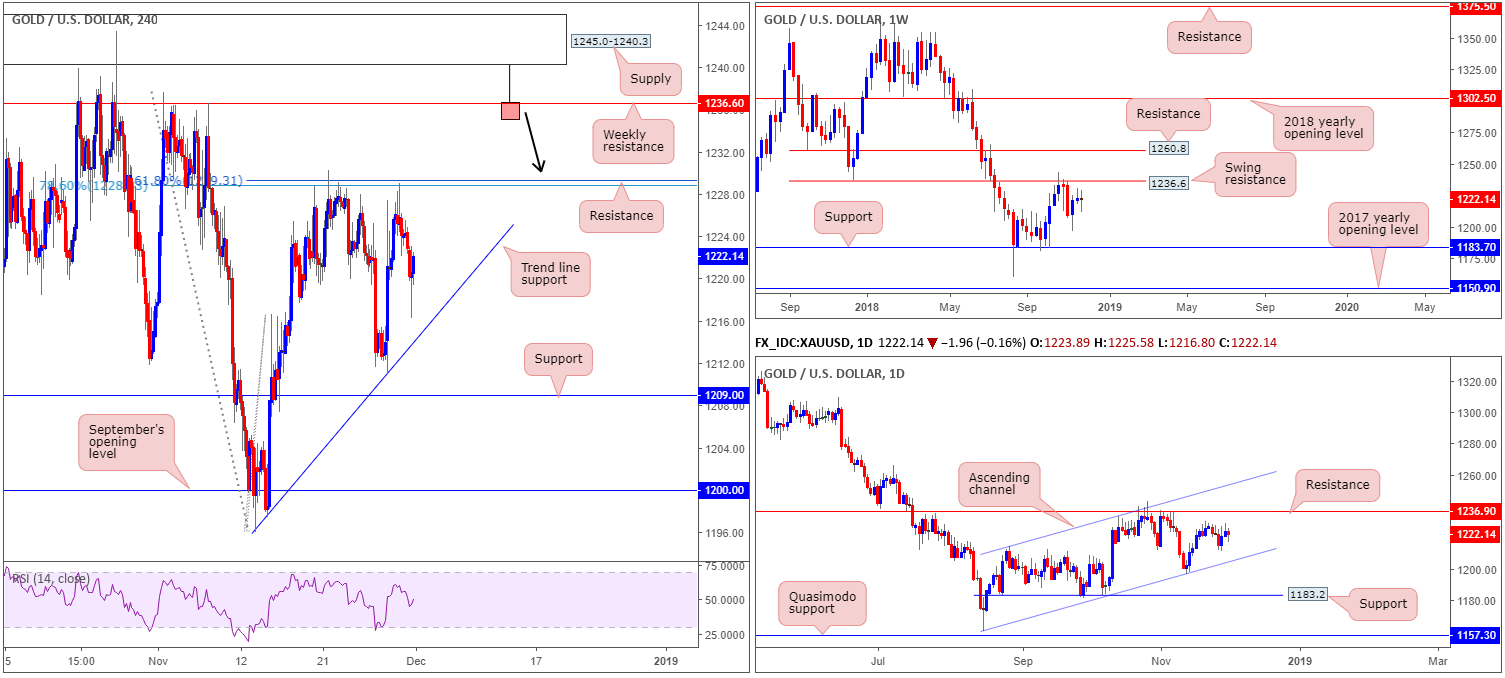
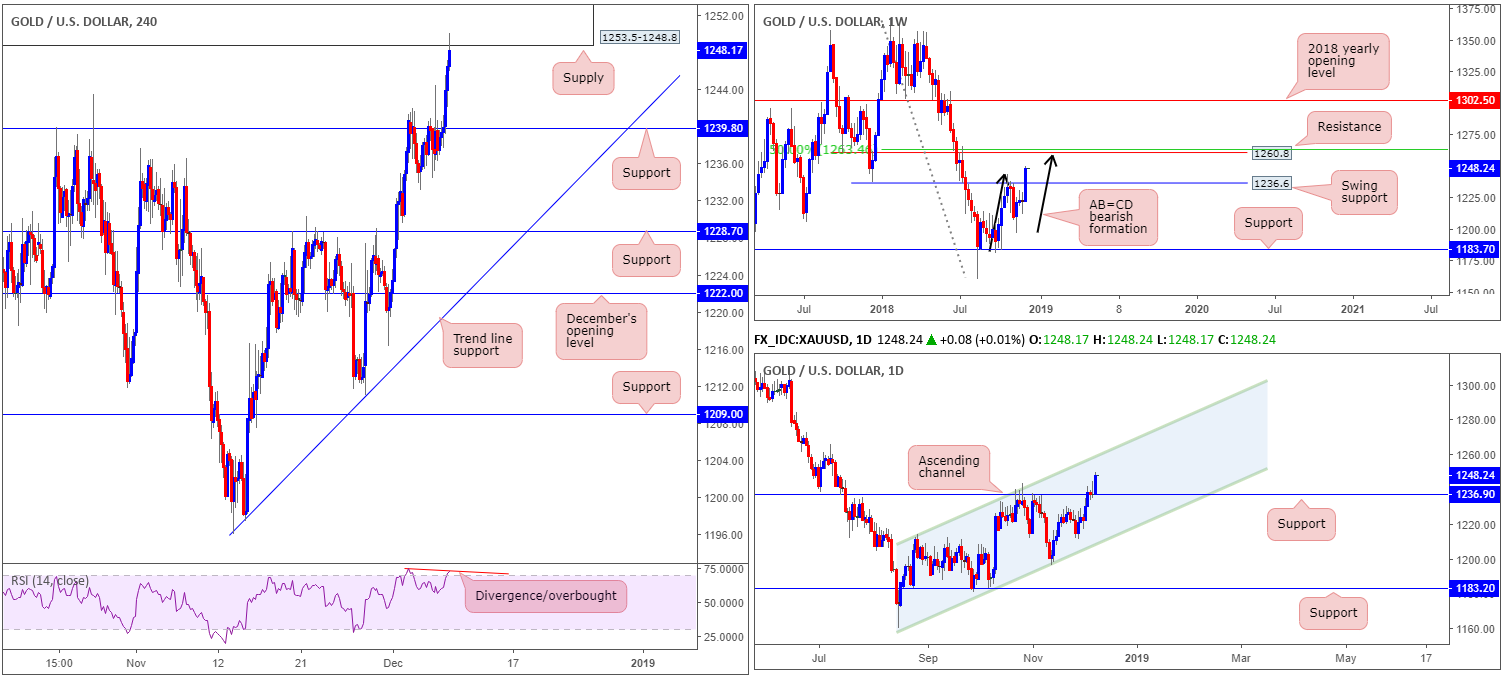
Over the course of last week, the precious metal crossed above a swing resistance at 1236.6 in strong fashion (now acting support). Should price continue to emphasize a bullish presence from here, resistance seen at 1260.8 is likely the next hurdle in view. What’s also interesting about this level from a technical perspective is it converges closely with an AB=CD bearish completion point (black arrows) and a 50.0% resistance value at 1263.4.
Daily perspective:
Along the same vein as weekly structure, daily movement overthrew resistance at 1236.9 (now acting support) last week, likely clearing the runway north towards channel resistance (etched from the high 1214.3). Note this ascending level also fuses reasonably closely with the weekly resistance mentioned above at 1260.8.
H4 perspective:
The yellow metal advanced strongly against its US counterpart Friday, up 0.87% on the day. Bolstered by less-than-stellar US job’s numbers, the H4 candles challenged supply at 1253.5-1248.8 going into the closing stages of the week. Should the market observe a pullback print from this area (supported by the RSI indicator displaying a divergence/overbought reading), support at 1239.8 rests nearby as the next logical downside target. Whether the current supply area will be enough to stand up to higher-timeframe buyers, who, as we know from the analysis above, has room to press as far north as weekly resistance at 1260.8, is difficult to judge.
Areas of consideration:
With higher-timeframe action exhibiting space to explore higher ground this week, selling from H4 supply at 1253.5-1248.8 is precarious. One way to overcome this is to wait and see if H4 price chalks up a bearish candlestick formation. That way, traders are able to observe whether there are sellers interested here or not. The other benefit of waiting for confirmation is the candlestick structure offers entry/stop parameters, though most traders will likely opt to position stop-loss orders above the supply zone itself.
Another scenario that may play out this week is an engulf of the said H4 supply zone followed by a pullback to the H4 support at 1239.8 for a rally towards weekly resistance at 1260.8. The break through H4 supply theoretically clears the majority of sellers out of the market, unlocking the pathway north to higher levels off 1239.8.
The use of the site is agreement that the site is for informational and educational purposes only and does not constitute advice in any form in the furtherance of any trade or trading decisions.
The accuracy, completeness and timeliness of the information contained on this site cannot be guaranteed. IC Markets does not warranty, guarantee or make any representations, or assume any liability with regard to financial results based on the use of the information in the site.
News, views, opinions, recommendations and other information obtained from sources outside of www.icmarkets.com.au, used in this site are believed to be reliable, but we cannot guarantee their accuracy or completeness. All such information is subject to change at any time without notice. IC Markets assumes no responsibility for the content of any linked site. The fact that such links may exist does not indicate approval or endorsement of any material contained on any linked site.
IC Markets is not liable for any harm caused by the transmission, through accessing the services or information on this site, of a computer virus, or other computer code or programming device that might be used to access, delete, damage, disable, disrupt or otherwise impede in any manner, the operation of the site or of any user’s software, hardware, data or property.
Read More
  • Share This:  
  •  Facebook
  •  Twitter
  •  Google+
  •  Stumble
  •  Digg

Monday 3rd December: Weekly technical outlook and review.

EUR/USD:
Weekly Gain/Loss: -0.19%
Weekly Close: 1.1318
Weekly perspective:
Despite the EUR/USD range in excess of 130 pips last week, the pair concluded trade by way of an indecision candle, albeit sporting a mild bearish tone. With respect to structure, traders’ crosshairs likely remain fixed on resistance priced in at 1.1465 (which, as you can probably see, brings with it a nearby cloned trend line resistance [extended from the high 1.2413]), and demand coming in at 1.1119-1.1212.
Daily perspective:
Closer attention adds the possibility of an AB=CD bullish pattern (red arrows) developing this week, terminating within the upper limits of a demand drawn from 1.1171-1.1220 (glued to the top edge of the aforementioned weekly demand). If it follows the pair turns northbound prior to completing the harmonic formation, however, traders are urged to pencil in resistance at 1.1455 that merges closely with two Fibonacci resistances: a 61.8% and a 38.2% at 1.1469 and 1.1443, respectively.
H4 perspective:
Reclaiming a large portion of recent gains, Friday’s movement witnessed the EUR/USD recede lower, down 0.65% on the day. The greenback gained traction at the closing stages of the week, following a hotter-than-expected Chicago PMI reading at 66.4. As is evident from the H4 chart, the major ended the week shaking hands with November’s opening level at 1.1314, positioned just north of the 1.13 handle. It may also be worth noting there’s a trend line support (etched from the low 1.1216) seen close by and support coming in from 1.1270.
Areas of consideration:
Between 1.1270/1.1314, the H4 chart promotes a number of supports, which could, of course, hold price action higher. The only caveat here is the fact both weekly and daily timeframes display room to explore ground beyond these H4 supports, with the next higher-timeframe support not emerging until we reach the top edge of the noted daily demand at 1.1171-1.1220. As a result of this, traders are urged to exercise caution around the noted H4 supports.
In the event, our analysis proves to be correct and we print an H4 close under 1.1270, further selling towards daily demand is potentially on the table. A retest to the underside of 1.1270 in the shape of a bearish candlestick configuration (entry/stop parameters can be defined according to this pattern) would, according to the overall technical picture, be enough to justify an intraday sell sometime this week.
Today’s data points: FOMC Members Clarida, Quarles Williams, and Brainard speak; US ISM Manufacturing PMI.
GBP/USD:
Weekly Gain/Loss: -0.58%
Weekly Close: 1.2748
Weekly perspective:
Demand at 1.2589-1.2814 remains in the spotlight as buyers and sellers battle for position. As of late, price action has failed to produce anything meaningful to the upside from the demand, consequently reflecting a bearish tone. Outside of the demand base, the 2017 yearly opening level at 1.2329 is seen as the next downside support target.
Daily perspective:
In conjunction with weekly movement, daily flow suggests the pair might want to explore lower ground within the walls of the said weekly demand area. The candles, as you can see, are hovering north of the 1.2695 Oct 30 low. While a response from this neighborhood is certainly possible, the Quasimodo support seen at 1.2635 remains a far more appealing level. Aside from 1.2635 fusing with trend line support (taken from the low 1.1904), the approach, should we push for lower levels, will form by way of an ABCD bullish pattern (red arrows) terminating just south at 1.2614?
H4 perspective:
A quick recap of recent action on the H4 timeframe reveals the candles half-heartedly breached November’s opening level at 1.2767, exposing the lower edge of the current range at 1.2729 (yellow zone). Traders are also urged to pencil in the 1.27 handle, resting just south of this consolidation
Should buyers enter the market from the lower edge of the aforesaid range, not only will they have to contend with possible selling from the underside of November’s opening level, but nearby trend line resistance (extended from the high 1.3174) is also a concern.
Areas of consideration:
Medium term, the focus is on the lower edge of the current H4 consolidation at 1.2729, though buying this market from here is a challenge, not only because of the nearby H4 resistances mentioned above, traders also need to take into account the somewhat bearish stance seen on the higher timeframes at the moment.
Ultimately, we feel 1.27 will be consumed this week, leading to a move south towards the daily Quasimodo support mentioned above at 1.2635. A retest to the underside of 1.27 in the shape of a bearish candlestick configuration (entry/stop parameters can be defined according to this pattern) would, according to the overall technical picture, likely be enough to justify a sell sometime this week.
Today’s data points: UK Manufacturing PMI; MPC Member Haldane Speaks; FOMC Members Clarida, Quarles Williams, and Brainard speak; US ISM Manufacturing PMI.
AUD/USD:
Weekly Gain/Loss: +1.12%
Weekly Close: 0.7308
Weekly perspective:
The Australian dollar chalked up healthy gains vs. its US peer last week, adding more than 80 pips in value. The commodity currency witnessed a resurgence of bidding take shape following a to-the-pip test of its 2017 yearly opening level at 0.7199. Continued buying from this neighborhood may lead to a test of notable resistance priced in at 0.7371. This resistance has served as a critical level in this market for a number of years, and, therefore, commands attention.
Daily perspective:
Things start to become concerning for the bulls, however, once the daily structure is taken into consideration. Recent buying brought the market into a resistance area at 0.7350-0.7313, which happens to converge with a nearby trend line resistance (drawn from the high 0.7483). The research team feels this area, although weekly price shows scope to possibly extend higher, is likely to continue hindering upside.
H4 perspective:
Friday’s action on the H4 timeframe was somewhat uneventful, as price attempted to press for the lower ground under 0.73, though failed to breach lows of 0.7284. Despite the unit reclaiming 0.73+ status into the close, stop-loss orders beneath 0.73 have likely been tripped, consequently exposing nearby support at 0.7277.
Areas of consideration:
Should the H4 candles print a decisive close under 0.73, this, according to our technical studies, is a strong sign daily sellers are wanting to take things lower from here. H4 support, as highlighted above, rests nearby at 0.7277, though with overhead selling pressure from the daily timeframe, we expect this level to be taken out and price head in the direction of October’s opening level at 0.7229 (at this point the market would also be sited just north of daily demand at 0.7164-0.7224 – the next downside target on the daily scale).
For conservative traders interested in selling this market, you might want to consider waiting and seeing if the H4 candles consume 0.7277, and then attempt to enter short on any retest of the level as resistance (red arrows – preferably in the shape of a bearish candlestick formation as this will provide entry/stop parameters).
Today’s data points: FOMC Members Clarida, Quarles Williams, and Brainard speak; US ISM Manufacturing PMI.
USD/JPY:
Weekly Gain/Loss: +0.49%
Weekly Close: 113.45
Weekly perspective:
Over the past couple of weeks, the weekly candles have been capped between supply at 115.50-113.85 and the 2018 yearly opening level at 112.65. Beyond this level, traders likely have their crosshairs fixed on demand coming in at 110.38-111.48, whereas a break above the current supply has the 2017 yearly opening level to target at 116.97.
Daily perspective:
In terms of daily structure, areas worth keeping an eyeball on this week fall in at a trend line support (extended from the low 109.77), which merges closely with support drawn from 112.11. To the upside, the 114.23 Nov 12 high is likely next in line, shadowed closely by Quasimodo resistance priced in at 114.45.
H4 perspective:
The closer analysis draws attention to H4 price fading a 61.8% Fibonacci resistance value at 113.72 into the closing stages of the week. Thanks to this, the research team has noted a potential AB=CD (green arrows) bullish pattern that completes just south of 113 around trend line support (extended from the low 111.37).
Areas of consideration:
If the H4 candles continue pressing for lower ground this week and complete the aforementioned AB=CD bullish pattern, a bounce higher is likely on the cards to at least 113.20ish. Why only a bounce is simply because the weekly price may pressure the unit towards it's 2018 yearly opening level mentioned above at 112.65, which, as you can see, on the H4 timeframe merges closely with support at 112.67 and a 161.8% Fibonacci support. Longs from this level, therefore, are also of interest this week. Ideal entry comes in the form of a bullish candlestick signal as this not only provides buyer intent, it also serves as a way of defining entry/stop parameters. The next upside hurdle from 112.67, should the area be tested, falls in at 113.
Today’s data points: FOMC Members Clarida, Quarles Williams, and Brainard speak; US ISM Manufacturing PMI.
USD/CAD:
Weekly Gain/Loss: +0.49%
Weekly Close: 1.3285
Weekly perspective:
The USD/CAD enjoyed another successful session last week, increasing its value by more than 60 pips. Support at 1.3223 remains in the fold after being marginally overthrown the week prior as resistance. Continued buying from current price could lead to a test of nearby supply at 1.3540-1.3387 (houses the 2017 yearly opening level within at 1.3434).
Daily perspective:
In conjunction with the weekly flow, we can also observe daily price respecting support carved from 1.3260. The concern here, nevertheless, is resistance is seen overhead at 1.3347 and the daily candles have printed little in terms of bullish intent over the past couple of days. In fact, Friday’s session concluded by way of a bearish pin-bar formation.
H4 perspective:
Disappointing Canadian growth figures immediately saw the USD/CAD explore higher ground, reaching highs of 1.3327 before swiftly returning to just north of pre-announcement levels. H4 Quasimodo resistance at 1.3329 was tested shortly after the event, which held ground and forced the H4 candles sub 1.33 into the closing bell.
Beneath 1.33, demand at 1.3235-1.3264 remains in view, which happens to house the daily support mentioned above at 1.3260 within the upper limit of its area. Should the H4 candles continue pressing lower today, however, a symmetrical AB=CD (red arrows) bullish pattern might complete just north of trend line support (taken from the low 1.2916) and the round number 1.32. It might also be worth noting the RSI indicator is seen fast approaching trend line support.
Areas of consideration:
Should the aforementioned H4 AB=CD bullish formation take shape today/early week and price tests the H4 trend line support (taken from the low 1.2916) an intraday long from here is considered high probability, with stop-loss orders, either tucked beneath 1.32 or beneath the 161.8% H4 Fibonacci ext? the point at 1.3169. Why high probability comes down to the fact the AB=CD pattern also merges closely with weekly support mentioned above at 1.3223. As for take-profit targets, the team has noted 1.33 as a logical starting point.
The only grumble here is in order to reach AB=CD completion, a move below daily support at 1.3260 and H4 demand at 1.3235-1.3264 will have to occur, thus potentially attracting sellers.
Today’s data points: FOMC Members Clarida, Quarles Williams, and Brainard speak; US ISM Manufacturing PMI.
USD/CHF:
Weekly Gain/Loss: +0.21%
Weekly Close: 0.9988
Weekly perspective:
By way of two back-to-back reasonably nice-looking bullish pin-bar formations, the USD/CHF appears set to explore higher ground this week. The only problem with this is the weekly timeframe shows resistance plotted nearby at 1.0029 in the shape of the 2016 yearly opening level. Also worth taking into account is the chart confirms the next support target does not come into view until the 2018 yearly opening level at 0.9744.
Daily perspective:
In line with our weekly assessment, the daily structure reveals price action ended the week engaging with resistance at 0.9986. The level, as you can see (yellow), boasts incredibly strong historical significance, and, therefore, has a chance of holding ground. The downside from this angle, apart from local support around 0.9920ish, seems reasonably free until a support area seen at 0.9866-0.9830 enters the fold.
H4 perspective:
Broad-based USD buying lifted the USD/CHF higher for a second consecutive day Friday, delivering the H4 candles to 1.0000 (parity). Note this widely watched number is also surrounded by a 38.2% Fibonacci resistance value and a 127.2% Fibonacci ext. point both at 0.9993, along with a 50.0% resistance value at 0.9999. In addition to this, we can also see the H4 candles ended Friday’s session in the shape of a bearish pin-bar formation, as well as a potential divergence play being seen out of the RSI indicator by way of a double-top resistance.
Areas of consideration:
Although weekly action portends higher prices, daily/H4 confluence strongly suggests a move lower is in store, targeting at least 0.9960ish (an H4 demand marked with a green arrow at 0.9956-0.9969).
A sell on the back of Friday’s closing pin-bar gets one in at around 0.9986ish, with a stop-loss order planted above the prior candle’s high (1.0004) at 1.0006. This equates to a 20-pip risk with 26 pips to the first target: 0.9960. Beyond 0.9960, the team has the local daily support at 0.9920 in mind as an additional target, followed then by 0.99.
Today’s data points: FOMC Members Clarida, Quarles Williams, and Brainard speak; US ISM Manufacturing PMI.
Dow Jones Industrial Average:
Weekly Gain/Loss: +5.53%
Weekly Close: 25586
Weekly perspective:
After two weeks of consecutive selling, the Dow Jones Industrial Average sported a stronger-than-expected comeback last week. Rebounding firmly off a support area coming in at 23963-24224, and reclaiming its 2018 yearly opening level at 24660, the index erased a large portion of recent losses and closed in the shape of a near-full-bodied bullish candle. Further buying from current price has a Quasimodo resistance level at 26182 on the radar.
Daily perspective:
Supporting further upside this week is the daily timeframe. By way of five consecutive days of gains, all, apart from Thursday, reporting a strong close, the unit appears to be gearing up for further buying this week, targeting resistance priced in at 25822. A break beyond here will likely see an approach towards a proven supply coming in at 26536-26200.
H4 perspective:
A brief look at recent dealings on the H4 timeframe has strong buying entering the fold amid US hours. Headlines surrounding the meeting with US President Trump and China’s President Xi Jinping heightened the hopes of a positive outcome and improved market sentiment.
The H4 candles, although held beautifully Thursday as resistance, broke through 25478 Friday, concluding the session in the form of a near-full-bodied bullish candle. This has potentially set the stage for a continuation move north this week, targeting September’s opening level at 26034.
Areas of consideration:
All three timeframes suggest additional upside may be seen this week. An H4 retest of 25748 as support (black arrows), followed up with an H4 bullish candlestick pattern – think pin-bar and engulfing formations – would, according to the overall technical landscape, likely be enough to draw in buyers and bid price to daily resistance mentioned above at 25822, followed by September’s opening level at 26034 on the H4 and then the weekly Quasimodo resistance at 26182.
Today’s data points: FOMC Members Clarida, Quarles Williams, and Brainard speak; US ISM Manufacturing PMI.
XAU/USD (Gold):
Weekly Gain/Loss: -0.06%
Weekly Close: 1222.1
Weekly perspective:
In the form of a clear-cut indecision candle, weekly flow concluded the week unchanged just south of a swing resistance priced in at 1236.6. The resistance remains a point of interest on this scale, having seen the barrier hold price action lower in October.
Daily perspective:
Looking at this market in more detail, we can see the yellow metal is currently compressing within an ascending channel formation (1160.3/1214.3), with the candles possibly working their way towards a test of resistance at 1236.9 (essentially representing the weekly swing resistance mentioned above at 1236.6).
H4 perspective:
Lower down on the curve, resistance by way of two nearby Fibonacci levels: a 161.8% Fibonacci ext. the point at 1229.3 and a 78.6% retracement resistance at 1228.8 continue to have a marked effect in this market. Friday extended Thursday’s bounce lower from this level, influenced by a robust USD across the board. As attractive as the area may be, however, a move higher is still likely on the cards, according to our technical reading.
Areas of consideration:
Weekly swing resistance mentioned above at 1236.6 is of interest this week. This places the nearby H4 Fibonacci resistances in a vulnerable position. We would be surprised to see the H4 candles break beneath its trend line support (extended from the low 1196.0). In fact, this is a line worth watching for potential buying opportunities this week, should H4 price test the level in the shape of a bullish candlestick signal (entry/stop parameters can be defined according to this configuration). Upside targets from here fall in at the aforementioned H4 Fibonacci resistances, followed by the noted weekly resistance.
Something else to also keep an eyeball out for this week:
With H4 supply at 1245.0-1240.3 positioned just north of the current weekly resistance line, traders should prepare for the possibility of a fakeout play through the weekly level. In the event an H4 bearish pin-bar formation takes shape that pierces through the weekly resistance and tests the H4 supply (see H4 chart for a visual), this would be considered a high-probability shorting opportunity (stop-loss orders can be positioned either beyond the noted H4 supply or a few pips above the pin-bars wick), targeting 1229ish as an initial take-profit zone.

The use of the site is agreement that the site is for informational and educational purposes only and does not constitute advice in any form in the furtherance of any trade or trading decisions.
The accuracy, completeness, and timeliness of the information contained on this site cannot be guaranteed. IC Markets does not warranty, guarantee or make any representations, or assume any liability with regard to financial results based on the use of the information in the site.
News, views, opinions, recommendations and other information obtained from sources outside of www.icmarkets.com.au, used in this site are believed to be reliable, but we cannot guarantee their accuracy or completeness. All such information is subject to change at any time without notice. IC Markets assumes no responsibility for the content of any linked site. The fact that such links may exist does not indicate approval or endorsement of any material contained on any linked site.
IC Markets is not liable for any harm caused by the transmission, through accessing the services or information on this site, of a computer virus, or other computer code or programming device that might be used to access, delete, damage, disable, disrupt or otherwise impede in any manner, the operation of the site or of any user’s software, hardware, data or property.
Ex-dividends 03.12.2018
Read More
  • Share This:  
  •  Facebook
  •  Twitter
  •  Google+
  •  Stumble
  •  Digg

Infinity Scalper – super accurate buy/sell indicator for M1 & M5

infinityscalper is an indicator in the form of a histogram, which is located in the lower chart window. Changing the color of the histogram signals a change of trend and the need to open a trade. Infinity Scalper is provided with an alert and can send notices to the e-mail. According to the well-known developer Karl Dittmann, the indicator is super accurate and not repainted.
Characteristics of Infinity Scalper
  • Official website: infinityscalper.net
  • Platform: Metatrader4
  • Currency pairs: Any, recommended major
  • Trading Time: Around the clock, recommended European and American sessions
  • Timeframe: Only M1 and M5
  • Recommended broker:  Forex4you
Rules of trade by the Infinity Scalper
BUY - appeared green bar and alert
SELL - appeared red bar and the alert
EXIT (2 options) - when changing the signal to the opposite (1) or when a yellow bar appeared (optimal exit) (2):

  1. Conservative
  2. Medium
  3. Aggressive
  4. Custom (Period Setting)
I recommend using Infinity Scalper only in the Conservative mode and only on the demo account. Needs additional filters, such as this one.
In the archive Infinity_Scalper.rar:
  • InfinityScalper.ex4
  • InfinityScalper_Library_File.dll
  • Activation Code.txt
  • Infinity Scalper template.tpl
  •     Download
Read More
  • Share This:  
  •  Facebook
  •  Twitter
  •  Google+
  •  Stumble
  •  Digg
Older Posts Home

Forex Market Watch

Total Pageviews

fxdayprofit 2005 To 2017. Powered by Blogger.

About Me

fxdayprofit
View my complete profile

show hit country wise


Pages

  • Home

Copyright © Fxdayprofit | Powered by Blogger
Design by Hardeep Asrani | Blogger Theme by NewBloggerThemes.com | Distributed By Gooyaabi Templates